Greater Manchester Children & Young People Activity Levels 2021/22
41.7% of children and young people in Greater Manchester meet Chief Medical Officer guidelines and achieve an average of 60 minutes or more of physical activity a day. Whilst 36.6% are failing to achieve 30 minutes of physical activity a day.
The latest Active Lives Children and Young People (CYP) Survey data from Sport England for the academic year 2021-22 has been released and has highlighted the recovery from the impact Covid-19 has had on the activity levels of children and young people.
Nearly one in two (49.3%) CYP are active in Greater Manchester (GM), reaching Chief Medical Officer's (CMO) guidelines of 60 minutes of moderate physical activity a day.
This is a significant increase from 12 months ago (+7.5%) and shows recovery beyond pre-pandemic levels (+4.1%, academic year 2018-19). As well as being higher than national rates for the first time since the survey began (47.2% by +2.1%).

Overall:
- 49.3% of children and young people are active, average 60+ minutes of physical activity every day
- 22.0% are fairly active, achieve an average of 30-59 minutes of physical activity a day
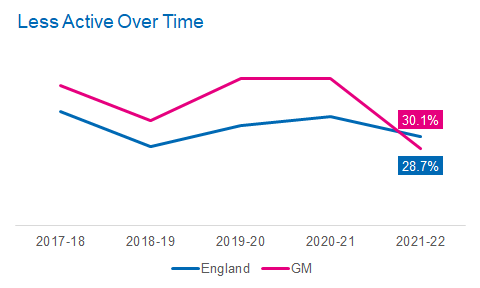
- 28.7% are inactive, do less than 30 minutes of physical activity a day.
Borough Level Data

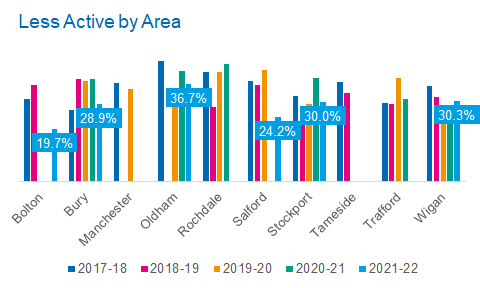
Inactivity rates vary considerably across Greater Manchester with there being a 17% gap between the borough with lowest levels of inactivity, Bolton (19.7%), and the borough with the highest levels of inactivity, Oldham (36.7%).
This gap between boroughs has remained the similar since the last release when there was an 17.2% gap.
Demographics

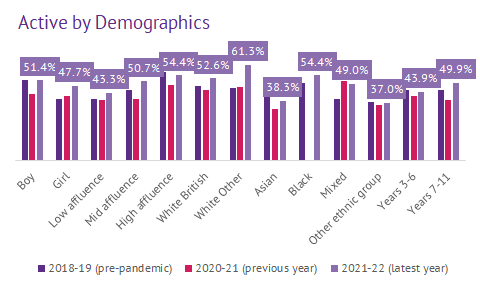
Across GM we see a difference in active levels' (on average achieving 60 minutes or more a day of moderate physical activity) recovery from pre-pandemic and change from the previous year's levels by demographics.
Older children and young people, in Years 7-11, girls, low and mid family affluence groups, as well as all ethnicities (except Asian and Other ethnicities) have seen a recovery and an increase beyond pre-pandemic levels.
Whilst all other demographics show an increase from the previous year, there are still gaps in active levels between gender, low to high family affluence, White British to Asian, Black, Mixed and Other ethnicities.
N.B. Some of the data has been suppressed because they have less than 150 responses in total or only 1-2 responding schools in the LA meaning the data is insufficiently reliable
Published December 2022
