Greater Manchester Adult Activity Levels November 2022-23
The latest Active Lives results published by Sport England show that 72.0% of adults in the region are active for at least 30 minutes a week, equating to 1,670,800 adults moving; an increase of 26,600 from the survey 12 months ago.

Greater Manchester Overview
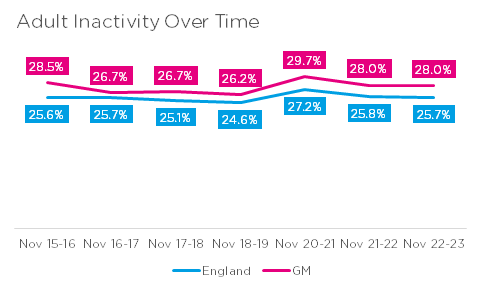
In the last 12 months activity (60.8%) and inactivity (28.0%) levels for adults have remained stable in Greater Manchester, similar to national trends.
Inactivity
The inactive proportion has remained stable at 28.0%, however, this is equates to a further 9,300 adults inactive with population growth from 12 months ago and is still above pre-pandemic levels (2018-19) of 26.2%.
Differences across demographics
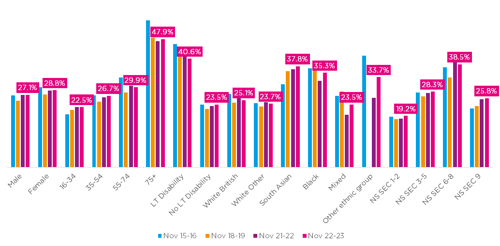
Those with a long-term disability or health condition, aged 75+ years and from lower socio-economic groups (NS SEC 6-8) remain the most likely to be inactive.
However, prior to the pandemic inactivity was reducing across all demographics, except South Asian, Black, Mixed and White Other ethnic groups, students or other occupations (NS SEC 9) and 16-34 years.
Although during the pandemic all demographics saw a rise in inactivity, in particular South Asian ethnic groups and lower socio-economic groups (NS SEC 6-8) by nearly or over 10% respectively.
Most have remained stable in the last 12 months and recovered to baseline levels, except student and other occupations (NS SEC 9), South Asian ethnic groups, lower socio-economic groups (NS SEC 6-8) and 16-34 years.
However those from lower socio-economic groups (NS SEC 6-8) and with a long term health condition or disability have seen inactivity levels fall in the last 12 months. Whereas those from Black ethnic groups have seen an increase in inactivity in the last 12 months.
For 16-34 years, South Asian ethnic groups and students or other occupations (NS SEC 9), this is a continued gradual increase, mitigating the pandemic years. Whereas lower socio-economic groups (NS SEC 6-8) although decreasing before the pandemic, have not recovered as other demographic groups. Potentially leaving these groups behind.
Differences across the boroughs
There remain clear differences in inactivity levels across the boroughs of Greater Manchester, with three boroughs better than the national average (Salford, Stockport and Trafford).
The gap between the boroughs with the highest and lowest levels of inactivity now stands at 9.6%, similar to 9.7% in November 2021-22.
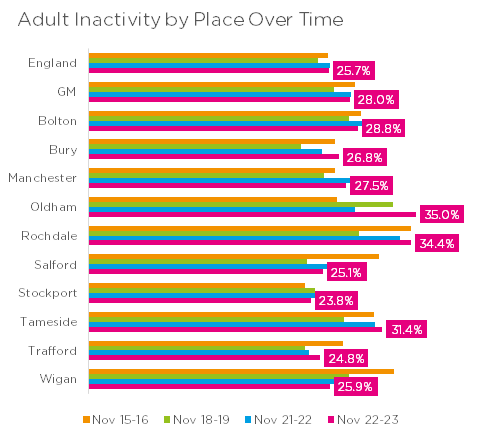
Half the boroughs have seen inactivity fall in the last 12 months if not significantly (Bolton, Manchester, Salford, Stockport and Wigan), whilst Oldham have seen a statistically significant increase (6.5%) in the last 12 months in inactivity.
Only three boroughs have recorded a statistically significant change since baseline (2015-16), Oldham (decrease in active & increase in inactive), Salford (increase active & decrease inactive) and Wigan (decrease inactive).
If you have questions about this data or would like access to the raw data please email: hazel@gmmoving.co.uk
All data is rounded to one decimal point.
Published April 2024.